PROFIT (WITH SAME SALES), AND GAINING AND RETAINING HIGH POTENTIAL EMPLOYEES.
INTRODUCING
TIME-DRIVEN ACTIVITY-BASED PROFIT/PRICING
NOT STANDARD GAAP TIME-DRIVEN ACTIVITY-BASED COSTING
EQUIVALENT DOLLARS
ENTANGLEMENT DOLLARS
Accurate
FUTURE
CURRENT
ALL ARE LOCATED ON ONE CLOUD-BASED PROFIT SCHEDULE
FOR US OWNED AND BASED COMPANIES ONLY
What is more important, cost or profit? In addition, both cost and profit utilizing standard GAAP account tools is a trailing fiction

Does your organization have a profit performance plan? Are you able to follow the plan? Is it delivering the right result?
If your plan isn’t set to push your aggregate profit from 4 – 5% to 16 – 17% using the same resources, you need a new plan!
QPS will help you make this dramatic profit improvement and allow you to see how profit flows through your workplace, tracking every stakeholder’s Key Performance Indicators (KPIs) in real-actionable time.
QPSs Profit Assurance System, a self-directed cloud mesh platform doesn’t interfere with any existing systems or processes including any financial reporting both internal and external.
INTRODUCING PROFIT BREAKTHROUGH

PROFIT IMPROVEMENT WHEEL
THINK YOUR PROFIT PERFORMANCE PLAN IS RIGHT FOR YOU?
THINK AGAIN!
WOULD YOU LIKE PROFIT TO GO FROM 4.97% TO 17.3% WITH THE SAME COMPANY RESOURCES INCLUDING KNOWING YOUR CURRENT PROFIT SITUATION BY EVERY STAKEHOLDER’S KPI’s REAL-ACTIONABLE-TIME?
ACTIVITY REDUCING SUNK PROFIT/PRICING TO NEAR ZERO!
WE MAY NOT LIKE IT — BUT THE BUSINESS WORLD HAS NEVER HAD THE LUXURY TO IGNORE CHANGE.
BILL GATES, “BUSINESS AT THE SPEED OF THOUGHT.”
YOU MUST ADDRESS CHANGES AT THE SPEED OF THOUGHT.
ADDRESSING CHANGES ON YOUR TIMETABLE IS
OVER :
- 1850 – The industrial revolution
- 1880 -1920 wasThe biggest change in the history of the world, from horse and buggy and the steam engine to almost everything we know and use today.
- 1950 – Statistical Process Control
- 1960 – MRP 1
- 1970 – MRP2, SPC, MIS, MBO,
- 1980 – TQM, TOC, ERP, SIX SIGMA, and many other process notions
- 1990 – Lean manufacturing
- 2000 – Lean Office, Lean Accounting
- 2004 – Quantum Profit System: Internet ASP, Profit Model, Profit Scheduling, Tomorrow Today and Profit Assurance System
- 2018 – QPS move the offering to the Azure SQL cloud platform
Since 1963 we have been on a remarkable journey. One that began with a tool and die apprenticeship and has culminated in the development of the most remarkable manufacturing and service sector management tool to have hit the business sector in decades. A tool that has been dreamed about but thought not possible, that has been sought after but not realized – until now.
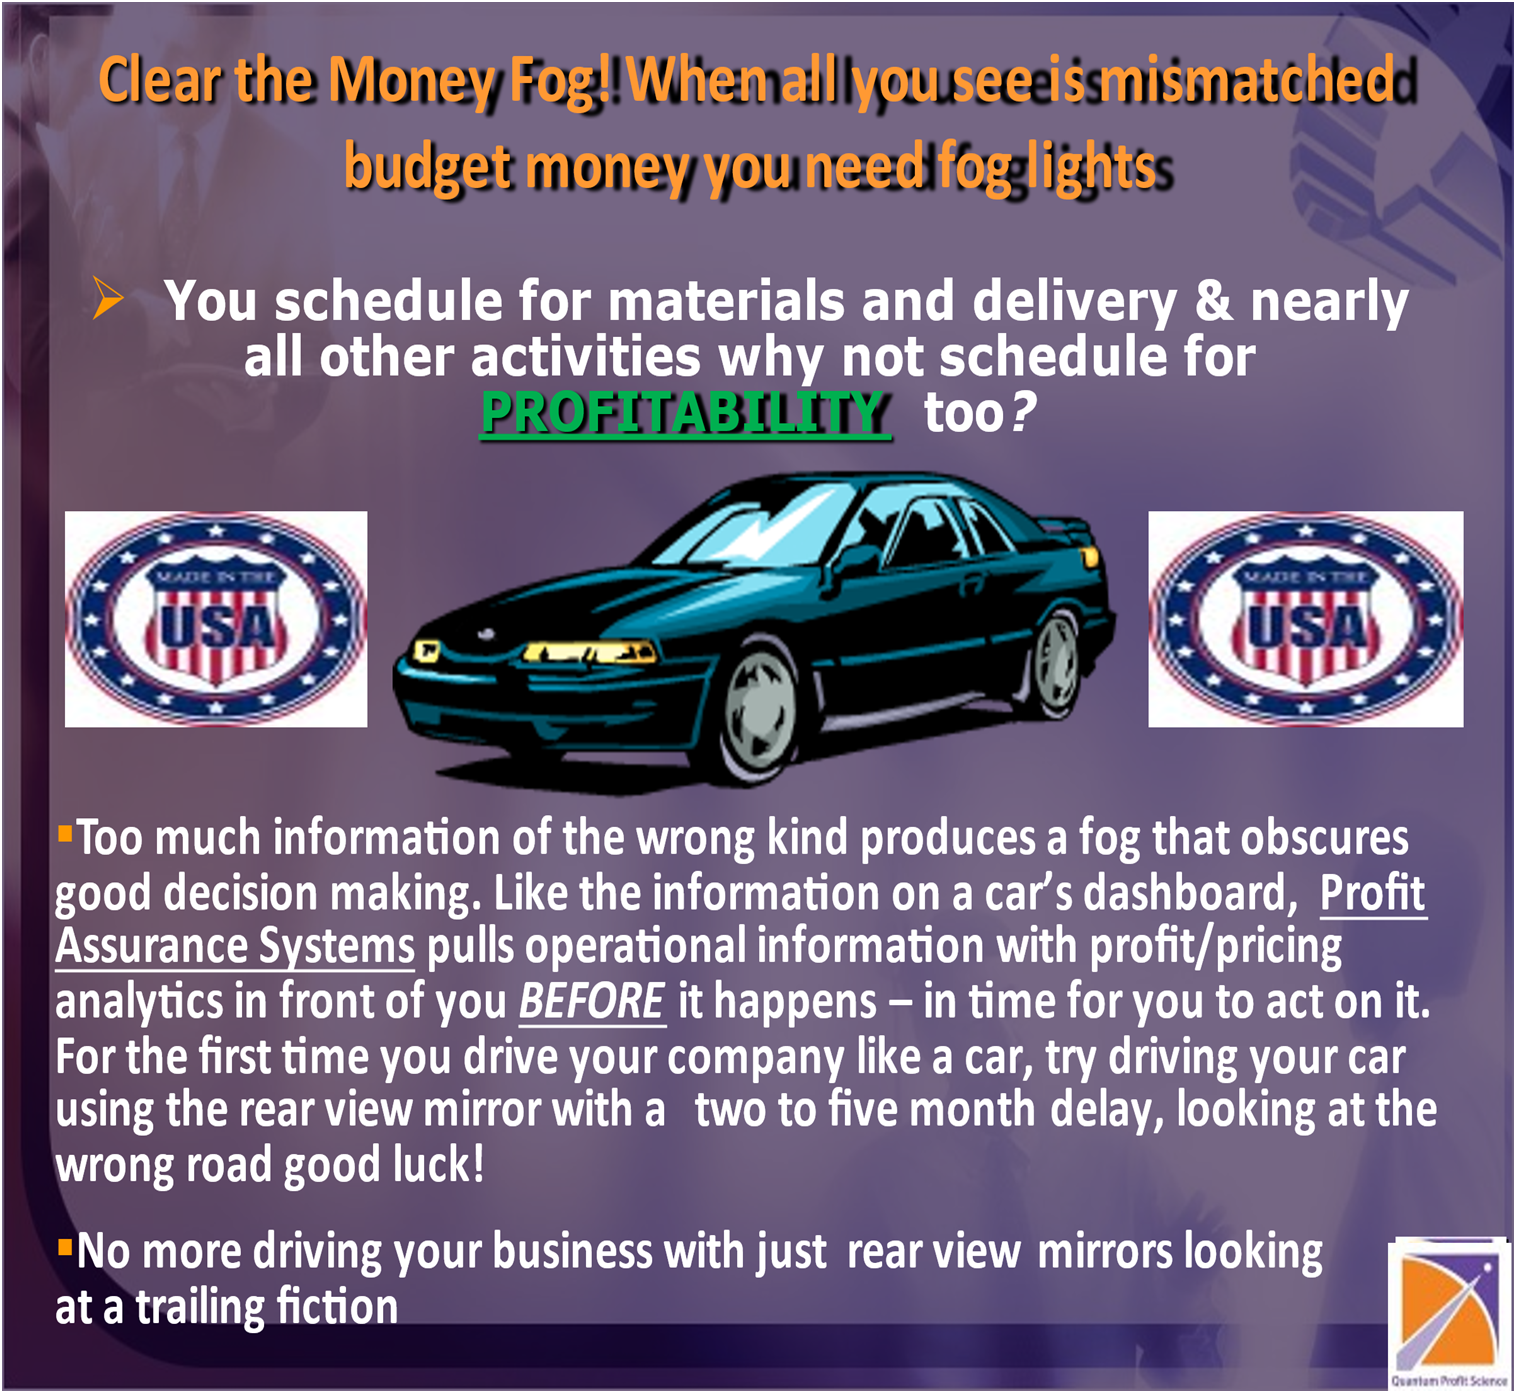
The tools offered by Quantum Profit System (QPS) puts profit/pricing control into the hands of operation and all stakeholders and promise to solve the fundamental problem that has plagued the business world for decades. Until now thought impossible to solve: The inherent disconnect between operations and finance that results in one hand not knowing what the other is doing. Renders profit nothing more than an intangible and “left over” variable and creates distrust and dissension within management and staff. All leading to the typical “rear window” accounting approach embraced by most companies: Attempting to go forward by looking into the past.
The story of these discoveries and the creation of QPS began in 1963 with a 12,000-hour journeyman tool and die apprenticeship at Continental Can Company. Back then Continental that was considered the Harvard of manufacturing, and to our good fortune was also one of the few companies that embraced Dr. Edward Deming’s Statistical Process Control. Continental had it right then. They had embraced Deming’s message to Japanese manufacturing and business and realized the value of statistical methodology in reducing expenses while increasing productivity and market share. The process at the time was referred to as industrial accounting and if you think about it, one realizes that the road to profit essentially begins with the engineering work statement. The precision of which in terms of defining qualitative and quantitative design and performance requirements sets the stage for either profit or loss by directly impacting quality and productivity before the fact.
Therefore, the critical path down the road to profit begins at the beginning: On the design table or with the bid work statement but somehow, we have landed in the wrong room – Accounting – when we should have stayed on the path of operational information, which we call “The World of Applied Operational Profit/Pricing”. For this is the only path that allows us to directly examine and manage profit where and when it is being produced. Where wealth is created not counted wrong.
This particular philosophy formed the backdrop against which approached subsequent studies took place at the University of Washington. During this time, I was asked to stay on at the UW to perform research in Applied Physics and Geophysics. It was there that I witnessed most people don’t spend the time to understand what is in the box including most new ideas reside on old principles which don’t change. If you don’t understand inside the box, you certainly can’t work outside the box with no reference starting point. The short version is QPS has turned profit upside right. Current standard GAAP top-down extractive culture aims at sales minus costs and profit is not known until after the fact, in fact, it is a trailing fiction.
The ensuing work in the academic arena and previous shop experience as a journeyman tool and die maker, solidified the shop knowledge (where the rubber meets the road). This prepared me well for the adventures ahead, and after ten years was eager to return to the private sector.
Landing in the aerospace industry, which places high demands on the embracing of process control and emphasizes the notion that there is a root cause for everything, and if you invest in the process you will discover that cause. Then found myself working as the plant superintendent of a major Boeing subcontractor. It was there that my senior mentor informed me that I had reached the pinnacle of my upward mobility within his company.
Thus, was the birth of the Profit Scheduling, which like a production control system, can inform you of all information pertinent to the financial health of an organization. This allows for profit/pricing to be the only number fixed, embedded into the schedule, and available instantly, “real-actionable-time.” The good news is that it comes directly from the activities to the decision makers, all the stakeholders on the Lean Value Stream who can impact change. The best news of all is that it does not go through accounting and becomes another history lesson of tenuous allocations and adjustments that don’t represent the current performance of the profit/pricing operations.
Over the next ten years, I successfully used this model many times in the turnaround industry to significantly enhance productivity and achieve management’s desired profit/pricing level. It is finally possible to determine the amount of equivalent sales dollars required to produce the profit/pricing made “real-actionable-time” on every job before it starts and manage one’s business remotely through the Cloud platform. This is accomplished by viewing real-time production (profit/pricing) figures instantly. Attack waste by identifying delays and rework using the Theory of Constraint and manage workflow to achieve maximum results and daily profit/pricing goals. We call it the future company-wide profit/pricing puzzle picture.
As noted by Peter Drucker in Managing in the Next Society: The Information Society, the major challenge of business over the next two decades involves dealing with a 500-year-old accounting system which turns out traditional but non-functional financial statements which are totally inadequate for the industrial and service sector in our changing world. This traditional reporting of goals in yesterday’s dollar terms only, (“if all you see is money you don’t see much at all”) provides no information on the nuts and bolts of operations as it relates to profit/pricing, information. That is critical for the successful performance of those responsible for producing long-term results the wealth and prosperity of the company. Profit Scheduling eliminates the fundamental fracturing of context between accounting, operations, and other finance functions caused by ineffectual financial statements by providing “real-actionable-time” objective data on factors directly bearing on the reality of operations. A “common language” among company players of multiple disciplines is thus generated which has the net effect of:
- 1. Dissolving the vicious cycles of distrust and fear invisibly generated by financial statements which are operationally useless and destructive to a self-running and self-improving business system;
- 2. Increasing individual awareness of one’s role as it directly relates to profit/pricing goals;
- 3. Increasing individual awareness of one’s role as it directly relates to profit/pricing goals;
- 4. Significantly improving individual responsibility and ownership for contributions made;
- 5. Dramatically reducing the need for Production Control meetings, as you know where every order is and how it pertains to your planned profit/pricing;
- 6. Allows for Accounting to do its intended job address external reporting such as your tax requirements, banking, and investor reporting; QPS doesn’t impede the creation, publication, and the distribution of external reporting.
- 7. For the first time, matching the order on the floor with the current financial analytic conditions and it address the equivalent sales requirements to maintain the on-demand contribution margin to ensure the protection of the planned profit/pricing, not an old estimate, pricing that has no bearing on the current financial conditions.
The product has come full circle to what Continental Can called Industrial Accounting and has gone a huge step beyond traditional accounting practices, including the application of Dr. Eliyahu Goldratt’s Theory of Constraint. Again, the good news is that this information comes directly from the activity to the decision-makers and does not go through Accounting. Allowing the decision makers to accomplish the tasks in the World of Applied Operations Profit/Pricing Continuous Improvement Wheel.
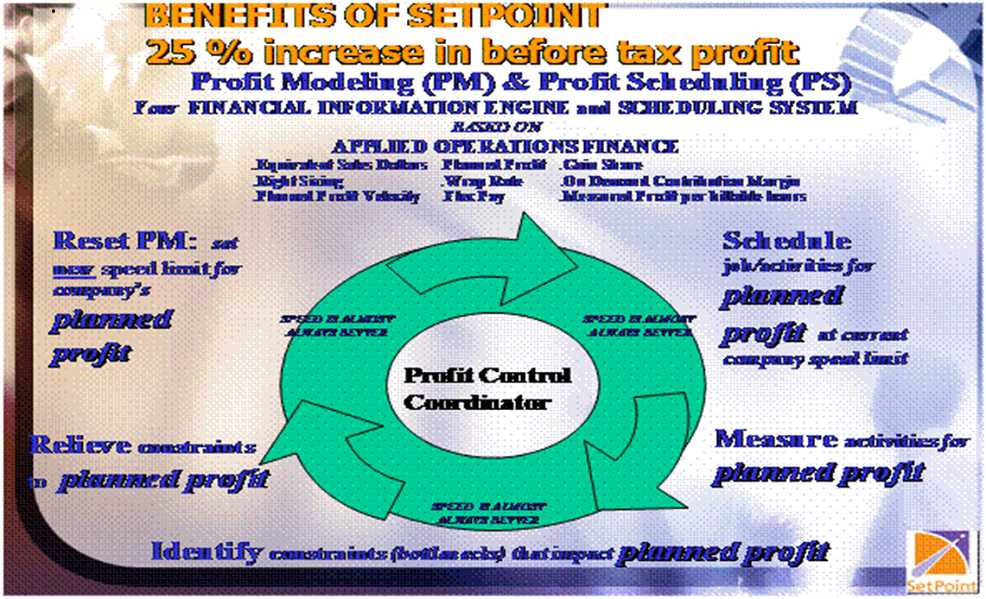
With our Profit Modeling Program and Profit Scheduling tool and using Dr. Eliyahu Goldratt’s “Theory of Constraints,” measuring constraints in equivalent sales dollar profit, by activity and by order. We begin by producing a financial profit/pricing road map of the company using Profit Modeling and then follow it with our Profit Scheduling tool supported by Tomorrow Today and Profit Assurance System. Then profit/pricing is embedded into the schedule and is the first step toward turning planning into profit/pricing reality. We move to scheduling profit/pricing t0 fill the company to jobs and activities capacity for the desired level of planned profit/pricing. Measuring those jobs and activities for the desired level of planned profit and identifying constraints that threaten to have a negative impact on the desired level of planned profit/pricing before the
fact. After relieving those constraints, the Profit Model Program is reset to the new speed limit for the company’s planned profit/pricing, and the process repeats. Hence, leadership is able to assume a true pilot position within one’s company and for the life of one’s company, with a continually functioning program that provides full command of the process. This is necessary to increase speed and efficiency, satisfy customers, cut costs, and enhance margins to the maximum degree and ensure quality. The last step is to reward your most valuable asset your employees for their participation in that end. Without their support and participation, your planned profit is just a pipe dream.
Far more than a tool, our Profit Modeling, Profit Scheduling Tomorrow Today, and Profit/Pricing Assurance System was produced in the heart and soul of business and not in some think tank or consulting firm. Tried and tested, it has surpassed our expectations, that in 2004 we put the entire program on the Internet, so it would be available for public consumption. Now it is a cloud platform. With this wonderful tool managing one’s company, with caution and fear, go the way of the dinosaur. Leadership is provided with the ultimate weapon allowing for the effective management of the business with a heightened state of urgency so necessary to succeed in the highly competitive global world in which we now live, and ALL must face.
APPENDIX -A- HOW IT WORKS
WHAT IS THE PROFIT MODEL PM?
IT ALLOWS YOU TO RUN THE
OPERATIONAL DECISION RACE
FOR PROFIT/PRICING!!
PM
LESS TAX
LESS MATERIAL
LESS MATERIAL MARKUP
LESS OUTSOURCING
SALES DOLLARS UNDER THE
COMPANY ROOF “BUILD DOLLARS
ALL VARIANCE MEASUREMENT IS ABOUT PERFORMANCE AGAINST DOLLARS UNDER THE COMPANY ROOF BUILD NUMBER.
SALES GENERAL &ADMINISTRATION:
ADMIN: you can measure each line item
FINANCE: as a contribution
MARKETING: to the hourly rate and company
ENGINEERING/ESTIMATE profit.
DIRECT COSTS & OVERHEAD
Total AD/L (BILLABLE) DOLLARS
Average billable hours (D/L hourly rate), (flex pay); every time pay changes it flexes the entire company, and changes the speed limit of the company in order to protect planned profit, (PPV Planned Profit Velocity)
An increase in D/L rate (billable hour rate) changes the relationship between direct labor dollars and the build number and creates a new equivalent sales dollar requirement causing the Profit Schedule to have a new speed limit to protect the planned engineered profit.
The Inventory Module: identifies the on-demand contribution margin required to produce the planned profit by making equivalent sales dollars a variable in Profit Scheduling. It is identified by order and operation/activity (The decision race to profit acted inreal-time.)
You can set the profit you want in equivalent sales dollars or percentage of the dollars under the company roof, making profit a constant. Everything is variable around profit.
COST TO DO BUSINESS BY BILLABLE HOURS (DIRECT LABOR):
The billable hourly rate is created accurately to the penny including planned profit:
Identifies average hourly rate x S.G.A. % of billable, direct labor dollars everyone in administration supports the value-add proposition of the company. (You can identify all administration activities and include them in the routing, supply chain. This is done in Profit Scheduling).
Profit in dollars per billable, direct labor hours
Material & outsourcing dollars are added to the hourly rate separate line item.
Slippage % based on equivalent sales being 100%
Adjusts the hourly rate if you pay employees to impact hourly rate requirements.
WHAT IS THE PROFIT SCHEDULING?
IT ALLOWS YOU TO PLAN SCHEDULE MEASURES AND REWARD FOR PROFIT
REAL-ACTIONABLE-TIME.
Profit Scheduling is the control device for tracking an order as it travels through the company with the planned profit embedded in the schedule. There are twelve reports that management can use to make decisions inreal-time to protect profit.
REPORTS:
- 1. Profit Scheduling:
- a. Informs you of the old jobs from past weeks (hotlist)
- b. Variable information to track order
- c. Scheduled activities for the week and the billable hours associated with those activities.
- d. Supplement dollars as required.
- e. Total current hours by order for the week
- f. % in and % out of equivalent dollars produced during current week (WIP $) real time.
- g. Incomplete hours by order current week.
- h. Required dollars per billable hours to maintain planned profit.
- i. Dollars per billable hours in the current order.
- j. Total planned profit in order.
- k. Sales dollars available on the order current week.
- l. Earned sales dollars on the order this week
- m. Value of the entire order
- n. Out-sourcing dollars and its relationship to the standard company in % of the order (equivalent) sales.
- o. Total hours on the entire order.
- p. Company work centers.
- 2. Work centers
- a. Work centers by noun name
- b. Scheduled hours by work centers current week using the theory of constraint for capacity planning.
- c. Week remaining hours by work center.
- d. Days remaining current week
- e. Employees are required to complete the current week’s work by the work center.
- f. Future remaining hours current week by work center.
- g. Total remaining hours of the order by work center
- h. Total remaining and completed hours this week by work center.
- i. Planned profit velocity speed at which the system provides work to employees based on their speed as it relates to the standard pay rate (flex Pay)
- j. Standard hours and overtime hours required current week by work center.
- k. Hours completed this week by work center.
- l. Hours as a% of total hours completed this week.
- 3. Financial Parameters
- a. Twenty-one-line items relating to the financial condition of the company including equivalent sales by closed activity by the day to ensure you are on schedule for planned profit.
- 4. Employee Assignment Summary
- a. Hours scheduled current week by an employee by day with totals.
- 5. Employee Detail Assignments
- a. Scheduled hours by employee by work center by job number by the day noted both complete and incomplete.
- 6. Throughput Report
- a. Hours completed (earned) by the week.
- b. You can look at multiple weeks or individual weeks.
- c. Shows earned dollars by the week.
- d. Shows break-even dollars by the week.
- e. Shows target dollars and % complete against the target.
- f. Actual hours bid actual hours earned and % efficient total company, by a week or by multiple weeks
- 7. Weekly Labor Report
- a. Payroll time keeping by employee regular hours, overtime hours, Holiday hours, vacation hours, and absent hours.
- b. By direct labor (billable hours) by work center.
- c. By indirect labor hours by work center or administration location.
- d. Compares actual applied hours against budget.
- e. Earned revenue by week.
- f. Weekly target by week.
- g. Weekly hours as a percent of the budget by week.
- h. Expected target by week.
- i. Proficiency as a percent by week.
- 8. Work center Details
- a. Shows hours available by the work center using capacity planning and Using the theory of constraint in critical path planning.
- b. Shows incomplete hours and complete hours.
- c. Indicates standard hours and overtime hours and planned profit velocity factors when required by work centers.
- 9. Daily Operation
- a. By the work center by the employee, by the job noun name, by the job number, and the hours scheduled for the week.
- 10. Earned Hours
- a. Measures earned hours against bid hours weekly or multiple weeks
- b. By employee, date activity was closed, by job number, by noun name, by operation/activity, by work center.
- c. Measures earned against actual hours used and efficiency % by the employee and total company.
- 11. Completed Job Report
- a. Shows the date and time a job was closed, job number, and noun name.
- b. Shows job value and supplement dollars as required.
- c. Can date range as needed.
- 12. Incomplete Jobs Report
- a. Shows the date job was entered into the system.
- b. Shows the date the first activity was completed.
- c. Job number.
- d. Noun name.
- e. Job value.
- f. Supplement value.
- g. Total value of open orders.
- h. OPERATING PARAMETERS
- 13. Employee List
- a. Employees.
- b. Active or not.
- c. Work centers they can work in.
- 14. Order Review (Estimating)
- a. Enter value of order.
- b. Enter hours in billable hours by work center.
- c. Enter outsource dollars.
- d. Establishes the value of the order against the Profit Model (current financial conditions)
- e. Shows required equivalent sales rate
- f. Shows bid equivalent rate
- g. Shows planned profit for this order.
- h. Shows supper profit (profit/pricing above planned profit/pricing)
- i. Shows total profit/pricing.
- j. Allows you to modify order for new % of planned Profit.
- k. Allows you to reduce billable hours by % of bid hours.
- 15. Jobs
- a. This is where you construct the control document to drive the orders down the critical path and schedule all activities for planned profit
- b. The header information and all the information from the order review Module is uploaded to the job module.
- c. This is where you accomplish either forward or back scheduling which is done automatically using the theory of constraint to ensure you adequately schedule your company for its total capacity and critical path
- d. This is where you assign the employees to the activities.
- e. This is where you record their performance against the plan.
- f. This document the Routing travels with the order.
- 16. Routings
- a. This is where you create the critical paths for your work statement this is maintained in a history file that is automatically provided to choose from when you create the job.
- 17. Shops, Skills, and Work centers
- a. All parts of the company set up.
WHAT IS TOMORROW TODAY?
IT IS THE LOOK AHEAD STANDARD OPERATINGPROCESS FULL PULL.
WHERE THE FUTURE COMPANY-WIDE PROFIT/PRICING PUZZLE IS CREATED AND UPPER MANAGEMENT CAN RUN PARALLEL SCENARIOS (“WHAT IFS”) OF NEW COMPANY CONFIGURATIONS”) INCLUDING AN AGREED TO LEARNING CURVES
Tomorrow Today is where the company can forecast the future company-wide profit/pricing puzzle picture with an agreed learning curve for competitive profit/pricing using improved profit/pricing numbers yet to be accomplished.
- 1. Profit/Pricing Engineering and Profit/Pricing,
- a. Develop the new bidding, profit/pricing utilizing the PM profit/pricing analytics to be assigned to the engineering work statement.
- b. Develop new backroom standards with the agreed to learning curve from the PS history.
- c. This is a full pull process.
- d. Develop the category/class for work statements going through operations and S.G.&A.
- e. All stakeholders are now on the critical path of capacity planning not just factory-applied direct labor.
- f. Departments that don’t actually touch the activities on the critical path capacity planning are measured by the PM and included in the throughput time constraints.
- g. Develop the touch times for each prospective activity.
- h. Develop the Profit Flow Days for each Lot (TAKT Time).
- i. Incorporate the continuous improvement wheel.
- j. Develop both Discrepancy Review Committee and Profit/Pricing Discrepancy Review Committees.
- k. Develop the Protect number for profit slippage (sunk profit/pricing) time. (TOC) buffer.
- l. Develop the routings for all the category/class work going through Factory Overhead.
- j. Develop the profit/pricing engineering specifications
- k. Develop the Buck Sheet parameters by category/class.
WHAT IS PROFIT/PRICING ASSURANCE SYSTEM?
VALIDATION OF ALL THE PROFIT/PRICING ENGINEERING SPECIFICATIONS WITH ACTUAL WORK GOING
THROUGH OPERATIONS IN THE CURRENT TIME FRAME.
- a. All activities in Tomorrow Today are measured against current activities in the Bow Wave (Back Log)
- b. Identify all activities that do not meet or exceed current backroomstandards including the learning curve to profit/pricing engineering.
- c. This process is completed prior to Work in Progress (WIP) prior to issuance on the shop floor to ensure all profit flow day requirements will be met.
- d. Provide to Marketing, Sales the new required work statement capabilities for their effort to garner new business by category/class